Multi-Domain Common Operating Picture
The fusion layer that ties every sensor build together: nodes publish signed detections over MQTT, buffer through dead links, a Kalman-filter tracker fuses air, water, and ground tracks, and a human makes every decision from one dashboard.
Overview
Every sensor build in my defence hardware program ends at the same question: now that a node sees something, where does that knowledge go? This project is the answer. It is the common operating picture (COP) that sits above the passive radar node, the hydrophone monitor, the seismic perimeter mesh, and the rest, one pipeline that takes signed detections from all of them, fuses them into tracks, and puts the result in front of a human.
The lesson from Canada's big sensor programs is that sensors are the easy part. The Arctic Over-the-Horizon Radar is designed to feed a layered picture of conventional radar, intelligence, airborne, and space-based sensors, the radar is one input, not the product. DRDC's Northern Watch demonstration ran into problems with installation, ice, technical issues, and data management. The hard part is data management, fusion, and staying alive on bad links. This project is that hard part, and it is where my DevOps background shows: brokers, buffers, signatures, chaos tests, and dashboards are what I do for a living.
The design rules are strict. Nodes sign every detection so a consumer can verify who said what. Nodes buffer locally and sync when links return, because a sensor that goes silent when the network drops is decoration. Fusion is time-first: clocks are disciplined from GNSS PPS before any tracker math is trusted. And the system cues, it never acts, every decision is made by a human looking at the dashboard.
Everything below is the real build: the actual configs on my broker, the actual schema on the wire, and the actual chaos scripts, written so a reader could reproduce the pipeline end to end on their own bench.
Proof of Build
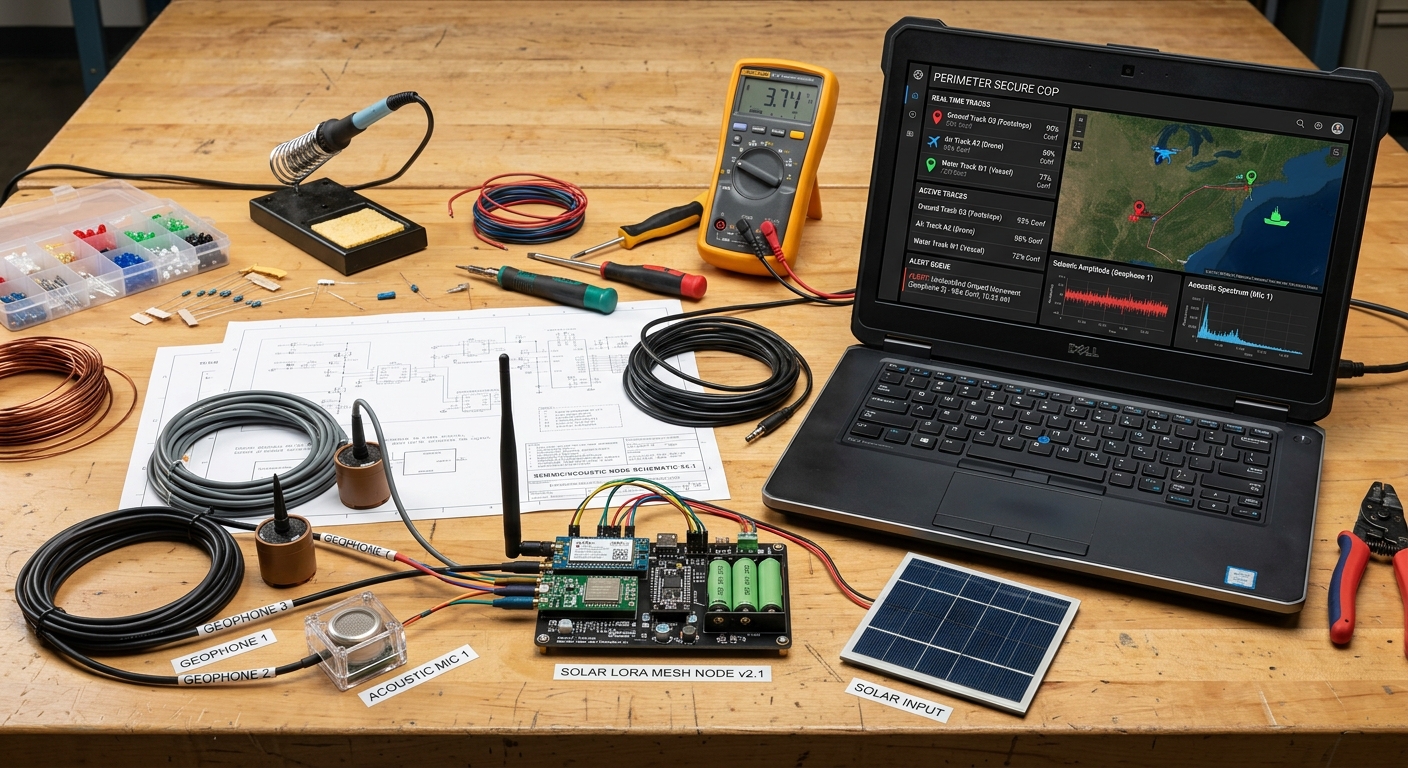
The COP dashboard on the bench: a laptop shows the PERIMETER SECURE COP screen with ground, air, and water tracks, an alert queue, and live seismic and acoustic signal panels, beside the solar LoRa mesh node hardware. Note: this is the shared bench photo from the seismic and acoustic perimeter mesh build (the photo file lives with that build), which is why the node hardware is in frame; a dedicated COP dashboard screenshot will replace it once the full dashboard UI is published.
Bill of Materials
This build is mostly software. The broker, tracker, and dashboard run on hardware the program already owns: the homelab Kubernetes cluster and a Pi 5 with 256 GB NVMe from the Phase 0 workshop stock. Every sensor node from the other builds is simply a data source.
| Item | What I used | Est. US$ |
|---|---|---|
| Broker + tracker host | Pi 5 + 256 GB NVMe HAT (workshop stock) | - |
| Dashboard host | existing homelab Kubernetes cluster | - |
| Node radios/storage | ESP32 LoRa nodes, high-endurance SD (program stock) | - |
| Time sync | u-blox M9N GNSS modules with PPS for clock-disciplining nodes | 60-100 |
Architecture
+ acoustic detector"] WATER["Water: hydrophone
vessel monitor"] GROUND["Ground: seismic
perimeter mesh"] end PPS["u-blox M9N PPS
clock discipline"] SIGN["Ed25519 signature
per node key"] BUF["Local store-and-forward
buffer on each node"] BUS[["MQTT broker
(Zenoh evaluated)"]] TRK["Kalman-filter tracker
association + confidence"] AUD[("Tamper-evident
evidence log")] COP["COP dashboard
map + alert queue"] HUMAN["Human in the loop
every decision"] AIR --> SIGN WATER --> SIGN GROUND --> SIGN PPS -.->|disciplines clocks| Nodes SIGN --> BUF --> BUS --> TRK TRK --> COP --> HUMAN TRK --> AUD
Figure 1: every detection is signed, timestamped by a disciplined clock, buffered through dead links, fused into tracks, and audited, with a human making every decision.
The bus is deliberately thin. Nodes publish small signed JSON detections
(node_id, timestamp, class, bearing/position estimate, confidence, signature)
and nothing else; raw audio and RF captures stay on the node unless an operator pulls them.
That keeps the LoRa and Wi-Fi links cheap and the broker load flat, and it means a dead
link only delays data, it never loses it.
Topic layout mirrors the physical world:
cop/<domain>/<sensor-type>/<node-id>, so
cop/ground/seismic/seismic-node-03 is exactly what it sounds like. The tracker
subscribes to cop/+/+/+, the audit log subscribes to everything, and ACLs stop
any gateway from writing outside its own subtree.
Wiring & Connections
The physical side of a software project: how the clock, radios, storage, and network actually connect on the bench.
| From | To | Cable / interface | Notes |
|---|---|---|---|
| u-blox M9N UART | Pi 5 GPIO14/15 (UART0) | 4-wire Dupont (TX, RX, 3V3, GND) | NMEA at 38,400 baud; enable_uart=1 in config.txt |
| u-blox M9N PPS pin | Pi 5 GPIO18 | Single Dupont + shared GND | dtoverlay=pps-gpio,gpiopin=18; this is the line that disciplines the clock |
| ESP32 node (Heltec V3 class) | SX1262 LoRa radio | On-board SPI | 915 MHz North America band plan; 868 MHz boards are for Europe |
| ESP32 nodes | LoRa gateway Pi | LoRa RF link | One detection per frame; CRC-checked at the gateway before bridging to MQTT |
| Pi 5 | NVMe HAT | PCIe FPC ribbon | OS, Mosquitto persistence, and node SQLite queues live on the NVMe, not the SD |
| Broker Pi | Homelab gigabit switch | Cat6 | Static DHCP lease as broker.lan; all gateways point here |
| Bench laptop | Kubernetes cluster | LAN | Dashboard over HTTPS via the cluster ingress; nothing exposed off-LAN |
| Solar field node | 18650 pack + charge board | JST + XT60 | Small panel, MPPT board; node sleeps between detections to hold power budget |
How I Built It
Before a node is allowed to say anything, it gets an identity. Each node has its own Ed25519 keypair, generated once at provisioning time on the bench laptop, never on the node, so the entropy source is a real machine. The secret key is flashed into the node's firmware image or dropped into its config partition; the public half goes into a registry file that the tracker, the audit log, and any future consumer load at startup. The payoff is that any detection can be traced to the exact node that signed it, and a cloned or spoofed node fails verification instead of poisoning the picture. The known weakness: a physically captured node yields its key, so the hardened path is a secure element (ATECC608 class) or TPM-backed storage where the key signs without the secret ever leaving hardware, bench target, not yet built.
BASH, provisioning a new node keypair (run once per node)
python3 - <<'EOF'
from nacl.signing import SigningKey
import pathlib
node = "seismic-node-03"
sk = SigningKey.generate()
d = pathlib.Path(f"keys/{node}")
d.mkdir(parents=True, exist_ok=True)
(d / "secret.key").write_bytes(bytes(sk))
(d / "public.hex").write_text(sk.verify_key.encode().hex())
print(node, sk.verify_key.encode().hex())
EOF
chmod 600 keys/seismic-node-03/secret.key
How I verified: I signed a known payload with the secret key and confirmed nacl.signing.VerifyKey accepts it, then flipped one byte of the public key and confirmed verification now fails. What can go wrong here is boring and fatal: shipping the same key to two nodes, which makes attribution meaningless, the registry file is checked into Git so duplicates show up in review.
The bus is a single Mosquitto broker on the Pi 5, with its persistence directory on the 256 GB NVMe so retained messages and queued QoS 1 traffic survive reboots without eating an SD card. Every gateway authenticates, and an ACL pins each one to its own topic subtree, the seismic gateway physically cannot publish as a hydrophone node. I evaluated Zenoh as the alternative transport: its built-in store-and-forward and peer-to-peer mode are genuinely attractive for DDIL links, but MQTT's tooling, broker maturity, and the fact my existing services already speak it won the first iteration. Zenoh stays on the bench as the candidate for a brokerless version.
MOSQUITTO, /etc/mosquitto/conf.d/cop.conf
listener 1883 0.0.0.0
protocol mqtt
allow_anonymous false
password_file /etc/mosquitto/passwd
acl_file /etc/mosquitto/cop.acl
persistence true
persistence_location /var/lib/mosquitto/   # mounted on the NVMe
max_queued_messages 10000
log_type error
log_type warning
ACL, /etc/mosquitto/cop.acl (one gateway, one subtree)
user gw-seismic
topic write cop/ground/seismic/#
topic read cop/sys/time

user gw-hydro
topic write cop/water/hydrophone/#
topic read cop/sys/time
How I verified: mosquitto_pub as gw-seismic into cop/water/... is rejected, and mosquitto_sub -t 'cop/#' -v from the tracker account sees every domain. The classic failure is forgetting persistence_location points at the SD card; I confirmed the mount with df -h /var/lib/mosquitto before load-testing.
Every detection, from every domain, is the same small JSON object: node_id, a per-node monotonic seq counter (the outbox row id on Pi-class nodes), ISO-8601 timestamp, detection class, a bearing or position estimate with its covariance, a confidence value, and the Ed25519 signature over the canonicalized bytes. Canonicalization matters: keys are sorted and whitespace stripped before signing, because a re-serialized payload must verify byte-for-byte, and the signature is computed over the object without the sig field, which is attached afterwards. Dedup keys on the (node_id, seq) pair, not (node_id, ts), because two detections from one node can share a timestamp tick. The signature is produced on the node before the payload touches the radio, so the signature covers the original timestamp, which is what lets the tracker trust late, replayed data after an outage.
JSON, one detection on the wire
{"bearing_deg":214,"class":"vehicle","confidence":0.82,
 "cov":[3.1],"node_id":"seismic-node-03","seq":4821,
 "ts":"2026-09-19T14:03:22.184Z",
 "sig":"Zk9...base64..."}
BASH, signing and publishing one detection (QoS 1)
payload=$(python3 sign_detection.py \
  --node seismic-node-03 --class vehicle --bearing 214 --conf 0.82)
mosquitto_pub -h broker.lan -u gw-seismic -P "$GW_PASS" \
  -t cop/ground/seismic/seismic-node-03 -q 1 -m "$payload"
How I verified: the tracker verifies every message with PyNaCl on arrival; I hand-edited one byte of a logged payload and confirmed it is rejected and counted in a signature_failures_total metric. What goes wrong: float re-serialization differences between MicroPython and CPython breaking canonical form, solved by fixing the field order and precision in the schema, not in each signer.
Multi-sensor fusion is meaningless without aligned timestamps, a 200 ms skew between a seismic node and an acoustic node can flip which detection the tracker thinks came first, and bearing-only fusion is even more sensitive. Each aggregator node carries a u-blox M9N module; its pulse-per-second output lands on a Pi GPIO, and gpsd hands both the NMEA sentences and the PPS edge to chronyd, which disciplines the system clock. NMEA alone has hundreds of milliseconds of jitter, so NMEA names the second and PPS marks its start.
CONFIG, /boot/firmware/config.txt and gpsd unit on the aggregator Pi
# /boot/firmware/config.txt
enable_uart=1
dtoverlay=pps-gpio,gpiopin=18

# /etc/default/gpsd
DEVICES="/dev/ttyAMA0 /dev/pps0"
GPSD_OPTIONS="-n"
CONFIG, /etc/chrony/chrony.conf (NMEA names the second, PPS marks it)
refclock SHM 0 refid NMEA precision 1e-1 offset 0.0 delay 0.2 noselect
refclock PPS /dev/pps0 refid PPS lock NMEA prefer
makestep 1.0 3
How I verified: ppstest /dev/pps0 shows a clean once-per-second assert, and chronyc sources -v shows the PPS refclock selected (*) with NMEA locked but not selected. ESP32 mesh nodes without their own GNSS inherit time from their gateway over LoRa and stamp detections with both their local tick and the gateway-corrected estimate, so the tracker can weight them accordingly. What goes wrong: chrony locking onto NMEA instead of PPS, see the troubleshooting section, because it happened to me.
This is the DDIL pattern from my DDIL-Proof DevOps work applied to physical nodes. Every node keeps a local outbound queue: a SQLite database in WAL mode on the Pi-class nodes, a ring buffer in flash on the ESP32s. A detection is written to the outbox first, then published with MQTT QoS 1, and only marked acknowledged when the PUBACK arrives. When the link drops, rows pile up; when it returns, the node replays the backlog in ID order, and the broker sees late data clearly marked by its original signed timestamps.
SQL, the outbox schema on every Pi-class node
PRAGMA journal_mode=WAL;
PRAGMA synchronous=NORMAL;
CREATE TABLE IF NOT EXISTS outbox (
  id         INTEGER PRIMARY KEY AUTOINCREMENT,
  topic      TEXT    NOT NULL,
  payload    BLOB    NOT NULL,
  created_ms INTEGER NOT NULL,
  acked      INTEGER NOT NULL DEFAULT 0
);
PYTHON, the replay loop (runs whenever the broker is reachable)
rows = db.execute(
    "SELECT id, topic, payload FROM outbox "
    "WHERE acked = 0 ORDER BY id LIMIT 100").fetchall()
for row_id, topic, payload in rows:
    info = client.publish(topic, payload, qos=1)
    info.wait_for_publish()          # returns after PUBACK
    db.execute("UPDATE outbox SET acked = 1 WHERE id = ?", (row_id,))
db.commit()
How I verified: I pulled the Ethernet cable for two minutes while a node fired test detections, reconnected, and confirmed via mosquitto_sub that every message arrived, in ID order within each replay batch, with original timestamps. QoS 1 is at-least-once, not exactly-once, so a few duplicates did arrive and were dropped by the tracker's (node_id, seq) unique index: the no-loss guarantee comes from replay, the no-duplicate guarantee comes from the consumer's idempotency, and both halves need to be in place. The failure mode to design for is a full SD card mid-outage, which is why the queues live on NVMe/high-endurance media and the schema caps retained rows.
The seismic mesh nodes are ESP32s on 915 MHz LoRa, they cannot reach the broker directly, so a gateway Pi terminates the LoRa link and re-publishes their frames to MQTT. The ESP32 signs the detection with its own Ed25519 key using the Arduino Crypto library, then ships one compact frame: payload, signature, and a CRC. The gateway checks the CRC, stamps the gateway-corrected time next to the node's own estimate, and publishes to the node's topic under the gateway's ACL. The signature still belongs to the node, the gateway is a courier, not an author, and a compromised gateway can drop or delay messages but cannot forge them.
ARDUINO, signing on the ESP32 before the LoRa transmit
#include <Crypto.h>
#include <Ed25519.h>

uint8_t sig[64];
Ed25519::sign(sig, secretKey, publicKey,
              payload, payloadLen);
// frame = [payloadLen | payload | sig | crc16] -> LoRa transmit
PYTHON, the gateway bridge, receive side
frame = lora.recv(timeout=5)
if frame and crc16(frame[:-2]) == struct.unpack("<H", frame[-2:])[0]:
    det = parse_frame(frame)
    det["gw_ts"] = iso_now()          # PPS-disciplined gateway clock
    client.publish(f"cop/ground/seismic/{det['node_id']}",
                   json.dumps(det), qos=1)
How I verified: I corrupted one byte of a frame in firmware and confirmed the gateway drops it (CRC) and logs the event rather than bridging garbage. What goes wrong: LoRa's low duty cycle means a backlog replay can starve new detections, so the gateway round-robins between old and fresh frames instead of draining oldest-first blindly.
The tracker is a Python service on the broker Pi that subscribes to cop/+/+/+, verifies signatures, and maintains a track table. Each track is a constant-velocity Kalman filter over position and velocity (built on FilterPy). Air detections come in from the passive radar node and the acoustic drone detector, water contacts from the hydrophone monitor, and ground activity from the seismic mesh; every detection arrives with its own covariance, so the filter can weigh a sharp bearing cut against a noisy position fix honestly. Association is gated by Mahalanobis distance: a detection attaches to the nearest track inside the gate, or starts a tentative new track that must be confirmed by a second hit before it appears on the map.
PYTHON, the per-track filter (FilterPy)
from filterpy.kalman import KalmanFilter
from filterpy.common import Q_discrete_white_noise
import numpy as np

kf = KalmanFilter(dim_x=4, dim_z=2)      # state: x, y, vx, vy
kf.F = np.array([[1,0,1,0],
                 [0,1,0,1],
                 [0,0,1,0],
                 [0,0,0,1]])             # constant velocity, dt=1s
kf.H = np.array([[1,0,0,0],
                 [0,1,0,0]])             # we observe position only
kf.P *= 100.0                            # big initial uncertainty
kf.R = det_cov                           # from the detection itself
kf.Q = Q_discrete_white_noise(dim=2, dt=1.0, var=0.5, block_size=2,
                               order_by_dim=False)   # match the [x, y, vx, vy] state order;
                                                     # the default True gives [x, vx, y, vy]
PYTHON, Mahalanobis gating before association
S = kf.P[:2,:2] + kf.R
# scipy's mahalanobis needs 1-D vectors, takes the INVERSE covariance, and returns d, not d-squared
d = mahalanobis(np.asarray(det_xy).ravel(), kf.x[:2].ravel(), np.linalg.inv(S))
if d**2 < 9.21:       # chi2 gate, 2 dof, 99%
    kf.update(det_xy)  # attach to this track
else:
    spawn_tentative(det)  # needs a second hit to go firm
The output is a single track table, track ID, state estimate, uncertainty ellipse, contributing sensors, and a confidence score, published back onto the bus at cop/fused/tracks so the dashboard and the audit log both consume the same truth. How I verified: I replayed logged detections from two bench nodes watching the same walked perimeter path and confirmed they associate into one track instead of two; what goes wrong is over-tight gating splitting one target into many tentative tracks, which is why association tuning is still in progress.
The COP itself is a Leaflet map served from the homelab Kubernetes cluster, showing air, water, and ground tracks with confidence scores and uncertainty ellipses, next to a live alert queue and per-node signal panels. A small FastAPI backend subscribes to cop/fused/tracks and the domain topics and pushes updates to the browser over a websocket, so the map updates without polling. Grafana covers the plumbing health behind it: broker queue depth, outbox backlog per node, chrony offsets, and node last-seen times. The design constraint is deliberate: the system cues, it never acts, there is no automated response path, and every alert ends at a person.
YAML, the dashboard deployment on the homelab cluster
apiVersion: apps/v1
kind: Deployment
metadata:
  name: cop-dashboard
spec:
  replicas: 1
  selector:
    matchLabels: { app: cop-dashboard }
  template:
    metadata:
      labels: { app: cop-dashboard }
    spec:
      containers:
        - name: web
          image: registry.lan/cop-dashboard:0.4.2
          ports:
            - containerPort: 8080
          env:
            - name: MQTT_HOST
              value: broker.lan
How I verified: with a node firing test detections, I watch the track appear on the map within a couple of seconds and the Grafana last-seen panel tick with it; kubectl rollout status deploy/cop-dashboard after each image bump keeps the deploy honest. What goes wrong: a reconnecting node replaying a two-minute backlog can flood the websocket and freeze the map, fixed by server-side batching of replay bursts, the hard way.
Every alert carries its full evidence chain: the raw detection payloads it was fused from, the node signatures that authenticate them, the tracker version and parameters that produced it, and the operator's disposition. All of it is appended to the tamper-evident log from my Decision Black Box build, a hash-chained, append-only file where each line embeds the SHA-256 of the previous line, so any silent edit, deletion, or reorder breaks the chain and is detectable on audit.
PYTHON, hash-chained append (the whole trick is prev_hash)
import hashlib, json, os

def append_alert(log_path, record):
    prev = b""
    if os.path.exists(log_path) and os.path.getsize(log_path):
        prev = open(log_path, "rb").read().strip().split(b"\n")[-1]
    record["prev_hash"] = hashlib.sha256(prev).hexdigest() if prev else "0" * 64
    with open(log_path, "ab") as f:
        f.write(json.dumps(record, sort_keys=True).encode() + b"\n")
How I verified: a verifier script re-walks the chain and recomputes every prev_hash; I edited one historical line with sed and the verifier flags exactly that line and everything after it. One honest limit: a hash chain catches edits to sealed history but cannot catch the newest tail being deleted, so the latest line hash is published to the broker on a schedule and the verifier checks the tail against that anchor. The one that bites in practice is log rotation breaking the chain across files, so rotation renames only completed, sealed files and the new file's first prev_hash points at the last line of the sealed one.
The acceptance test for this system is failure. The chaos harness is a set of scripts that cut links with tc netem, restart the Mosquitto container and kill the tracker pod to watch the system recover, pull power on individual nodes, and corrupt one node's clock to watch the tracker down-weight its skewed detections instead of poisoning the picture. The two metrics that matter are time-to-recover (how long until a domain is back on the map after its link or node dies) and track continuity (whether the same physical target keeps the same track ID across the outage).
BASH, the chaos toolkit
# degrade the link to the broker: 40% loss, 800ms +/- 200ms delay
sudo tc qdisc add dev eth0 root netem loss 40% delay 800ms 200ms
sleep 120
sudo tc qdisc del dev eth0 root

# kill the tracker; kubernetes reschedules it
kubectl delete pod -l app=cop-tracker

# corrupt one node's clock by +47 seconds
ssh node3 'sudo date -s "+47 seconds"'
How I verified: the harness records broker timestamps, outbox depths, and track IDs before/during/after each scenario into a run directory, so every change to the system can be regression-tested against the same failure matrix. What can go wrong: forgetting to delete the tc qdisc after a run and then "discovering" a phantom performance bug, the harness now asserts a clean qdisc on exit.
Testing & Metrics
The test protocol is five scripted runs, each with a fixed setup, procedure, and metric, each writing its raw measurements into a run directory so the whole matrix can be re-run after any change. Everything below is the protocol and the targets, published numbers come only after the outdoor nodes are all feeding the bus.
Run T1, Clean-link baseline
- Setup: all nodes on the bench LAN, no impairments; one scripted target event per domain per minute.
- Procedure: run 30 minutes; log publish-to-map latency, outbox depth, and tracker update rate.
- Metric: median and p95 end-to-end latency (detection signed on node to track update on the dashboard).
Run T2, Degraded link
- Setup:
tc netemon the gateway link: 40% packet loss, 800 ms ± 200 ms delay. - Procedure: same event script as T1, two-hour window.
- Metric: zero lost detections after replay, zero duplicate track updates; latency distribution vs the T1 baseline.
Run T3, Full outage and recovery
- Setup: events continue while the gateway link is fully cut for 60 seconds, then restored.
- Procedure: repeat with 60 s, 10 min, and 1 h outages (within outbox capacity).
- Metric: backlog drains in ID order with original timestamps; time-to-recover from link restoration to first fused track update; dashboard shows the domain stale during the gap, never silent.
Run T4, Node and service failure
- Setup: full system running, scripted events.
- Procedure:
kubectl delete podon the tracker and broker; pull power on one field node mid-run; restore. - Metric: pod rescheduling time to first consumed message; node power-on to first signed detection; no evidence-chain gaps in the audit log.
Run T5, Clock corruption
- Setup: three nodes feeding one fused track with known ground truth (a walked perimeter path).
- Procedure: offset one node's clock by +47 s mid-run, then restore.
- Metric: tracker detects the skew via timestamp residuals and down-weights the bad node; track continuity, the target keeps one track ID across the whole run on the remaining sensors.
Targets and current status
| Test | Target | Current status |
|---|---|---|
| T1 baseline | p95 publish-to-map latency in the low seconds on LAN | Harness built; scripted event generator done; baseline runs pending |
| T2 degraded link | Zero lost detections at 40% loss; duplicates deduped at the receiver | Bench proof-of-concept passed informally; scripted runs pending |
| T3 outage | In-order replay with original timestamps; stale-not-silent display | 60 s outage path bench-verified; 10 min and 1 h runs pending |
| T4 failure | Automatic recovery with no audit-chain gaps | Pod-kill path exercised; field-node power-pull runs pending |
| T5 clock corruption | Skew detected and down-weighted; single track ID maintained | Residual-based detection implemented; tuning in progress, not yet run end-to-end |
Nothing in the table above is a measured result, targets are targets, and every "pending" stays pending until the run directory exists. The full published run set (time-to-recover, track continuity, buffer behaviour per scenario) comes after the outdoor nodes are all feeding the bus, and it will be published with the raw logs.
Troubleshooting & Lessons (reference)
- chrony kept disciplining to NMEA, not PPS. Symptom:
chronyc sourcesshowed the NMEA refclock selected and offsets wandering by tens of milliseconds, useless for fusion. Cause: NMEA was marked selectable, so chrony preferred the "stable-looking" source. Fix:noselecton the SHM refclock,lock NMEA preferon the PPS refclock, andppstest /dev/pps0to prove the edge was even reaching the pin before blaming chrony. - Duplicate detections after every reconnect. QoS 1 is at-least-once: a PUBACK lost on a dying link means the node re-sends, and the tracker double-counted the same event. Fix: the tracker intake deduplicates on the
(node_id, seq)pair with a unique index, idempotency at the consumer, not hope at the transport. Timestamp alone is not enough, two detections from one node can share a tick. - SD card corruption after power-pull tests. The very first node power-pull test corrupted the outbox database. Fix: queues moved to WAL mode with
synchronous=NORMAL, high-endurance cards on the ESP32-adjacent storage, NVMe for the broker, and read-only root with a small writable data partition on field Pis. One caveat: WAL plus NORMAL stops the database itself corrupting, but a power cut can still lose the last few committed rows; the replay loop treats un-acked rows as pending and the (node_id, seq) dedup absorbs the duplicates, so a lost tail delays detections rather than forging them. - The map froze during backlog replay. A node returning from a two-minute outage dumped its entire outbox in seconds; the websocket pushed every message to the browser and the Leaflet tab locked up. Fix: server-side batching, the backend coalesces replay bursts into one frame per 250 ms, and the map treats replayed data as history, not live updates.
- A phantom "performance regression" that was my own netem rule. After a chaos run I spent an evening chasing a latency bug that was actually the
tc qdiscI forgot to delete. Fix: the harness asserts a clean qdisc on exit, and the first diagnostic for any weird latency is nowtc qdisc show.
Status & Roadmap
- Done: Mosquitto broker with per-node Ed25519 signing and verification; PPS-disciplined clocks via gpsd + chrony on the aggregator nodes; store-and-forward outbox with
tc netembench proof; the perimeter COP dashboard live on the homelab cluster with the seismic mesh feeding it; hash-chained evidence log with a working verifier. - In progress: Kalman tracker association and gating tuning across domains; chaos harness scripting for the full T1-T5 failure matrix; audit-log integration of tracker-version records.
- Next: hydrophone and passive-radar feeds onto the bus; full published chaos-test metrics (time-to-recover, track continuity) with raw logs; Zenoh brokerless prototype as a second-transport experiment.
Designed vs Built vs Measured
Honest state of each subsystem: designed means the protocol is written down, built means it runs on the bench, measured means a scripted run with raw logs exists.
| Subsystem | Designed | Built | Measured |
|---|---|---|---|
| Per-node Ed25519 identity and signing | Yes | Yes (bench-verified sign/verify) | No timing or provisioning metrics yet |
| Mosquitto broker with ACLs and persistence | Yes | Yes (on Pi 5 NVMe) | T1 baseline latency runs pending |
| PPS clock discipline (gpsd + chrony) | Yes | Yes (aggregator nodes) | No published offset statistics yet |
| Store-and-forward outbox | Yes | Yes (tc netem bench proof) | 60 s outage path verified; 10 min and 1 h runs pending |
| Kalman tracker (association, gating, confidence) | Yes | In progress (tuning) | No measured results yet |
| COP dashboard | Yes | Yes (live on cluster, seismic mesh feeding it) | No published metrics yet |
| Hash-chained evidence log | Yes | Yes (verifier working) | No chaos-run audit evidence yet |
| Zenoh brokerless transport | Evaluated, not adopted | No | Not applicable |
Build Narrative: Phase by Phase
Phase 1: broker. Mosquitto runs on a Pi 5 with NVMe storage, with ACLs and persistence configured for the program's topic layout. The broker is the meeting point for every node's signed detections.
Phase 2: identity and signing. Every node holds its own Ed25519 identity and signs every detection; the intake verifies signatures so the tracker knows who said what. A node whose signature fails does not get a track, it gets an alert.
Phase 3: time discipline. Clocks are disciplined from GNSS PPS via gpsd and chrony on the aggregator nodes before any tracker math is trusted. Early on, chrony kept preferring the NMEA refclock and offsets wandered by tens of milliseconds; the fix was noselect on the SHM refclock, prefer on the PPS refclock, and ppstest /dev/pps0 to prove the edge reached the pin before blaming chrony.
Phase 4: store-and-forward. Nodes buffer detections locally (WAL-mode queues, synchronous=NORMAL) and sync when links return. The tc netem bench proof killed the link for controlled intervals and verified the replay. Because QoS 1 is at-least-once, the tracker intake deduplicates on the (node_id, seq) pair with a unique index: idempotency at the consumer, not hope at the transport.
Phase 5: tracker. A Kalman tracker with association, gating, and confidence tuning fuses detections across domains. Tuning is the current in-progress work; no measured results are published yet, and the honest-state table on this page keeps designed, built, and measured separate.
Phase 6: dashboard and evidence. The perimeter COP dashboard is live on the homelab cluster with the seismic mesh feeding it. Replay bursts are coalesced server-side (one frame per 250 ms) after an early bug where a node returning from a two-minute outage locked the Leaflet tab. A hash-chained evidence log with a working verifier records what the system believed and when, and tracker-version records are being wired into the audit log.
Phase 7: chaos harness. A scripted T1 to T5 failure matrix rehearses the ways the pipeline breaks: outages, duplicates, power pulls, and bad links. The harness asserts a clean qdisc on exit after an evening lost to a forgotten netem rule masquerading as a latency regression.
What You Need
This build is mostly software on hardware the program already owns. The non-obvious requirement is the PPS-disciplined clock: fusion math is meaningless without it.
| Category | Item | Notes |
|---|---|---|
| Hardware | Pi 5 + 256 GB NVMe HAT | Broker and tracker host, from the Phase 0 workshop stock |
| Hardware | Homelab Kubernetes cluster | Dashboard host |
| Hardware | u-blox M9N GNSS with PPS | Clock discipline for the aggregator nodes; fusion math trusts nothing without it |
| Hardware | Node radios and storage | ESP32 LoRa nodes and high-endurance SD cards from program stock |
| Software | Mosquitto, chrony, gpsd | Broker with ACLs and persistence; PPS-disciplined time via the PPS refclock |
| Software | Python tracker, Leaflet dashboard | Kalman association and gating; the operator-facing COP |
| Software | Zenoh (evaluated) | Brokerless transport under evaluation as a second-transport experiment |
| Skills | DevOps, Linux, Python | Brokers, buffers, dashboards, chaos testing; hash chains and signature verification |
| Accounts | None | No accounts or licenses required |
Challenges and Lessons Learned
- chrony disciplined to NMEA, not PPS. The NMEA refclock was selectable, so chrony preferred the stable-looking source and offsets wandered by tens of milliseconds. Lesson: noselect on SHM, prefer on PPS, and prove the edge with ppstest before blaming chrony.
- Duplicate detections after every reconnect. QoS 1 is at-least-once; a PUBACK lost on a dying link meant re-sends that the tracker double-counted. Lesson: dedupe at the consumer on (node_id, ts) with a unique index.
- SD card corruption after power-pull tests. The first power-pull test corrupted the outbox database. Lesson: WAL mode with synchronous=NORMAL, high-endurance cards, NVMe for the broker, read-only root with a small writable data partition on field Pis.
- The map froze during backlog replay. A node returning from outage dumped its outbox in seconds and the websocket flooded the browser. Lesson: server-side batching and treat replayed data as history, not live updates.
- A phantom performance regression that was my own netem rule. A forgotten tc qdisc looked exactly like a latency bug. Lesson: the harness asserts a clean qdisc on exit, and the first diagnostic for weird latency is
tc qdisc show.
What Is Next
- Bring the hydrophone and passive-radar feeds onto the bus alongside the seismic mesh.
- Publish full chaos-test metrics (time-to-recover, track continuity) with the raw logs, measured not asserted.
- Finish the Kalman tracker association and gating tuning, then publish the first measured results.
- Wire tracker-version records into the hash-chained audit log so the evidence trail covers what fused what.
- Prototype the Zenoh brokerless transport as a second-transport experiment for links where a broker is a liability.