Daru: Your Logs, Your Hardware, Your SIEM
An open-source, self-hosted log analytics and SIEM platform in a single Go binary plus ClickHouse. Search, dashboards, alerts, incident triage, syslog, an append-only audit trail, and live packet capture, with no API keys, no cloud, and no per-GB licensing.
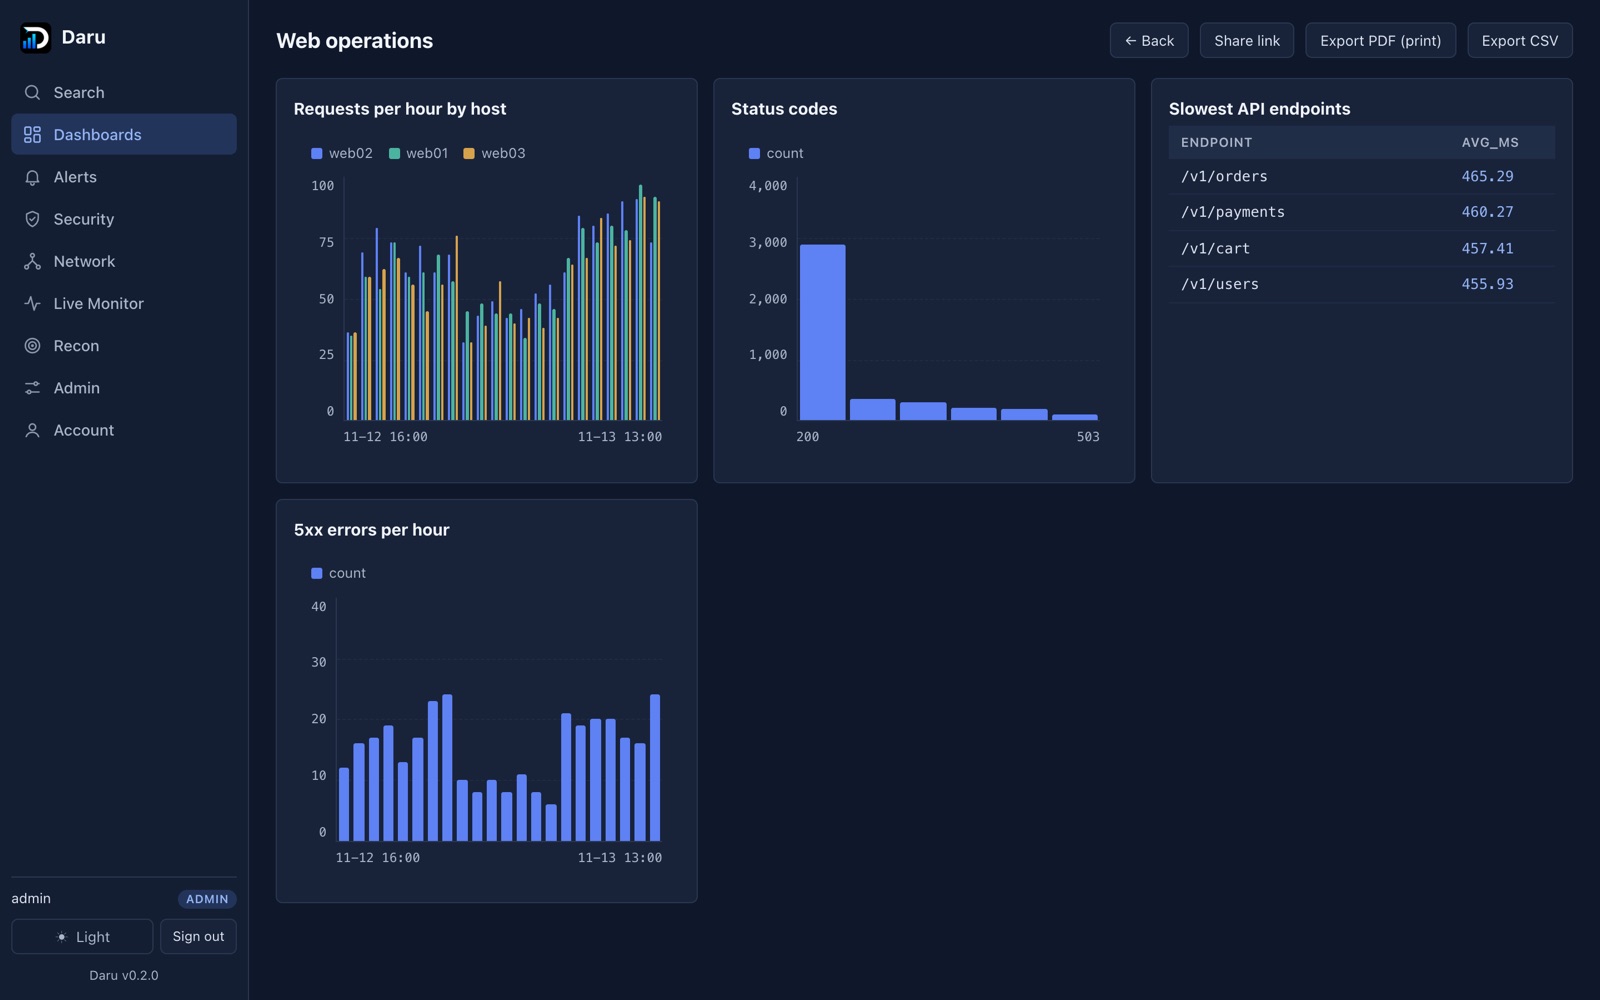
What You Will Learn / Do
- Run a full SIEM on your own hardware with one install command, or with Docker Compose.
- Send logs over Splunk HEC, raw HTTP, JSON, or syslog, and search them with a pipe query language that compiles to ClickHouse SQL.
- Build dashboards and scheduled alerts, triage incidents mapped to MITRE ATT&CK, and review an append-only audit trail.
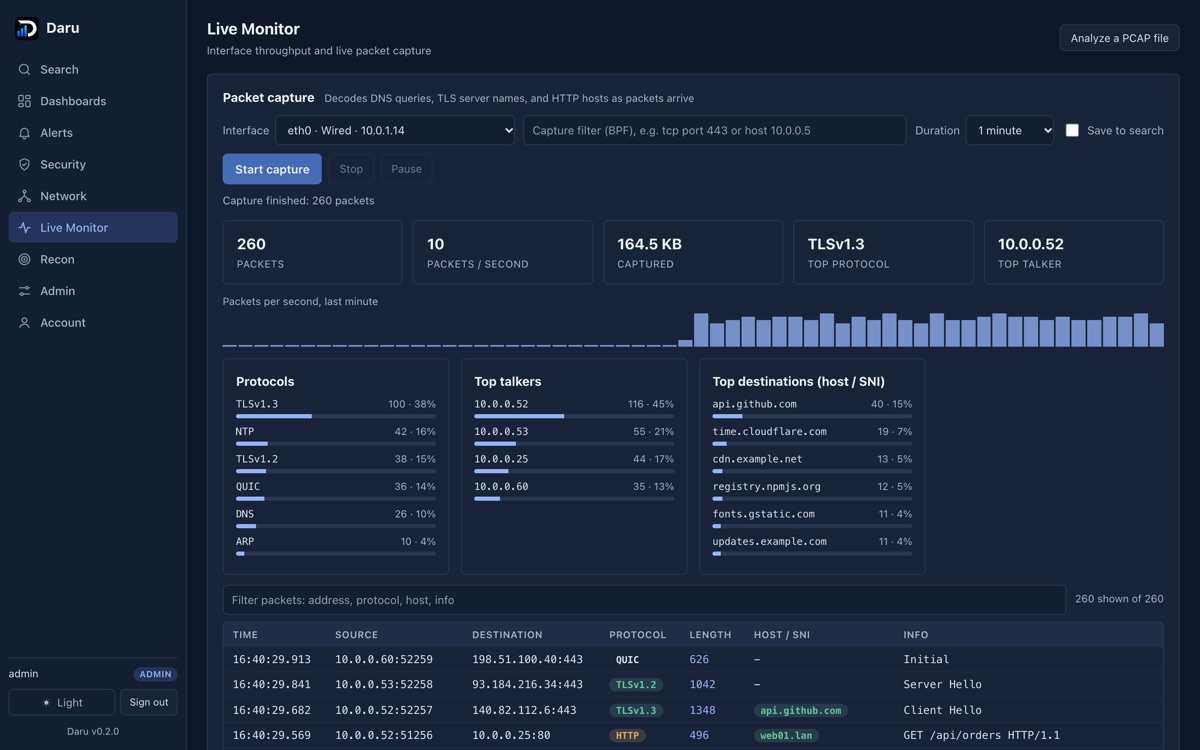
- Capture packets live in the browser, decode DNS, TLS SNI, and HTTP hosts, and download the capture for Wireshark.
- Stack: Go 1.27, ClickHouse 25.8, dependency-free JavaScript, tshark and tcpdump · License: MIT
Overview
Daru is an open-source SIEM (security information and event management) platform that runs entirely on hardware you control. It collects logs from servers, applications, firewalls, and network gear, stores them in ClickHouse, and gives a security team Splunk-style search, dashboards, scheduled alerts, and an incident queue, without API keys, a cloud account, or per-gigabyte licensing.
Everything except the database is one Go binary: the ingest endpoints, the query engine, the alert scheduler, the syslog receiver, the recon runner, and the web interface, which is embedded in the executable. The second and only other moving part is ClickHouse, a column store built to scan large volumes of log data quickly on ordinary hardware. A small team can run Daru on a single server, a mini PC, or a Raspberry Pi with 4 GB of RAM.
The Problem It Solves
Small and mid-sized organizations need the same visibility as large ones: who signed in, what changed, which host is being brute forced, which device just appeared on the network. Commercial SIEM products price by the volume of data ingested per day, so the bill grows with every log source, and the data usually leaves the building. Open-source stacks avoid the licence but usually mean running and tuning several services (collectors, a search cluster, a dashboard server, an alerting engine).
Daru takes a different trade: one binary, one database, sensible defaults, and the security controls a company needs (an audit trail, single sign-on, least-privilege storage, session management) built in rather than bolted on.
Architecture Overview
Data enters on the left, is stored in ClickHouse, and is read back through the query engine by the web interface, the alert scheduler, and the API. Every box inside the dashed area is the same Go process.
Figure 1. The two-process design: the Daru binary and ClickHouse.
How Logs Get In
Daru accepts four input formats. Every path ends in the same batching writer, under one shared events-per-second limit, so a flood on one input cannot starve the others or overwhelm the database.
Figure 2. Every input is checked, limited, and parsed before it is stored.
Each ingest token is bound to one index, and creating a token creates its index with a 90-day default retention. Syslog messages from a device whose clock runs ahead are stored at the time Daru received them, with the device's own time kept in a syslog_time field, so they never disappear from searches that end at “now”.
The Query Language
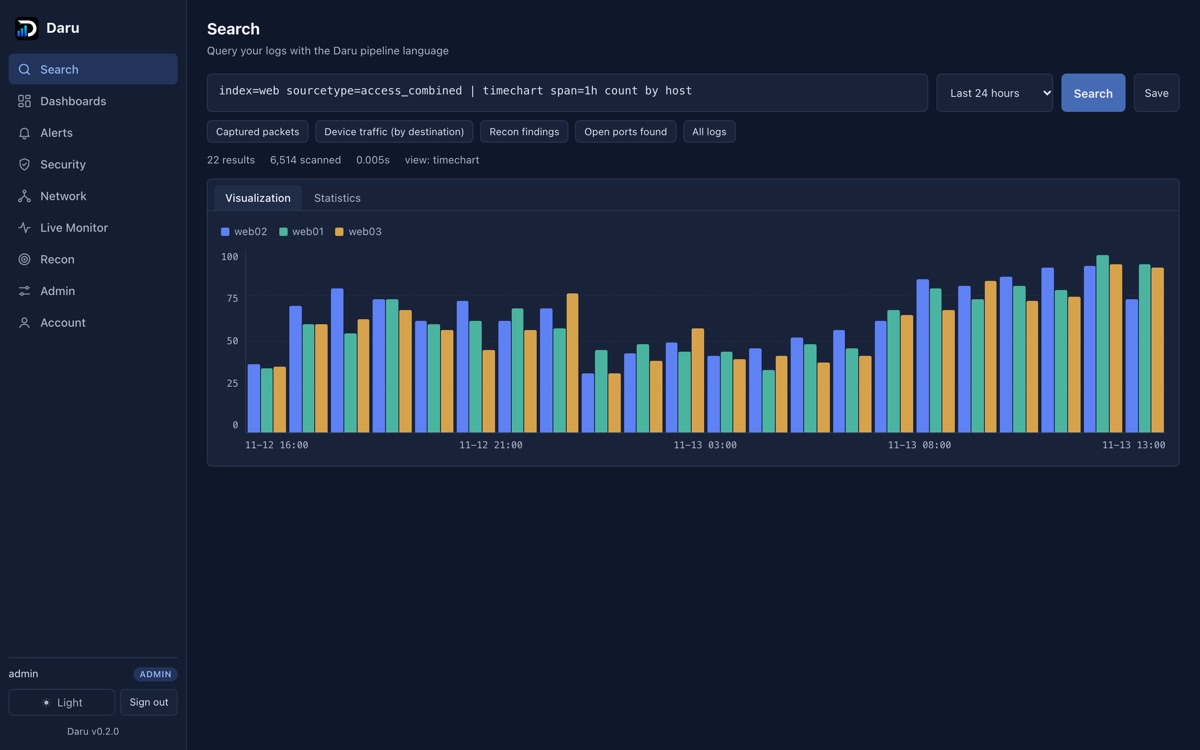
A query is a chain of commands joined by |. The first command filters events by index, field values, and free text; each later command transforms the result. Daru supports 22 commands:
| Group | Commands | What they do |
|---|---|---|
| Filter | search, where, dedup, head, tail | Keep the events you care about |
| Shape | eval, rex, spath, fields, table, rename, fillnull, bin, sort | Compute, extract, rename, and order fields |
| Aggregate | stats, eventstats, streamstats, top, rare | Counts, averages, distinct values, rankings |
| Visualize | timechart, chart | Series over time or by a field, drawn as charts |
| Test | makeresults | Generate rows to try expressions |
Queries are never interpreted row by row in Go. The parser builds a pipeline, and the compiler turns the whole pipeline into one ClickHouse SQL statement, with the caller's index permissions and the time range added as hard filters. This is the real output for a typical query:
index=web status>=500 | stats count by host | sort -countSELECT * FROM (SELECT * FROM (
SELECT `host` AS `host`, toFloat64(count()) AS `count`
FROM (SELECT _id, _time, _raw, host, source, sourcetype, index, fields
FROM `events`
WHERE index IN ('web')
AND _time >= toDateTime64('2026-11-12 12:00:00.000', 3, 'UTC')
AND _time < toDateTime64('2026-11-13 12:00:00.000', 3, 'UTC')
AND (toString(`index`) = 'web'
AND toFloat64OrNull(toString(`fields`['status'])) >= 500))
GROUP BY `host` ORDER BY `host` ASC)
ORDER BY isNull(toFloat64OrNull(toString(`count`))) DESC,
toFloat64OrNull(toString(`count`)) DESC, toString(`count`) DESC)
LIMIT 1000Figure 3. From query text to a chart: one round trip to the database.
Because index permissions are part of the compiled SQL, a user limited to the web index cannot read security events by writing a clever query: the filter is added outside anything the user typed. User searches also run with ClickHouse readonly=2, so even a compiler bug could not turn a search into a write.
Search Request Lifecycle
Figure 4. Every request is authenticated and scoped before it reaches the database.
Alerts and Incident Response
Any saved search can become an alert with a cron schedule, a condition such as count > 50, a severity, and an optional webhook. When the condition holds, Daru records the firing, sends a webhook signed with HMAC-SHA256 so the receiver can verify it came from Daru, and can open a notable event in the incident queue.
Figure 5. From a scheduled search to a closed incident.
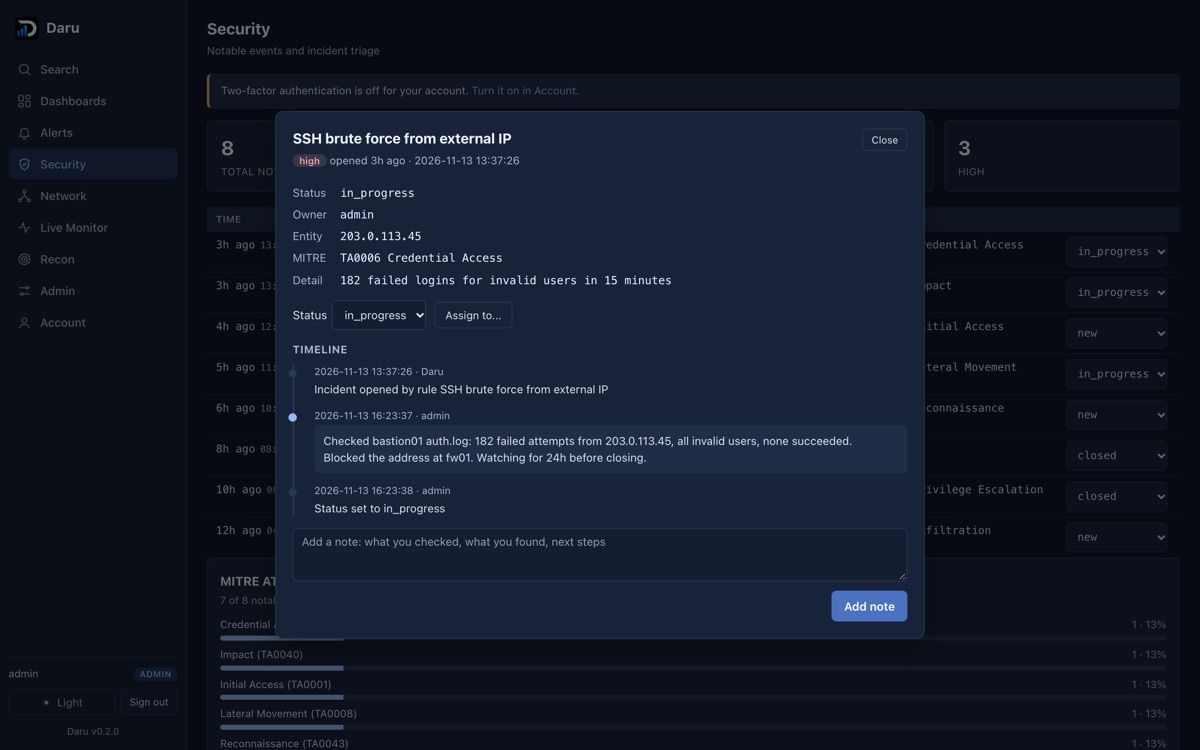
Each incident has a timeline. Analyst notes, assignments, and status changes are recorded on it with the author and time, and every change also goes into the audit trail. Incidents carry a MITRE ATT&CK tactic, and the Security page shows coverage: what share of incidents falls under Credential Access, Lateral Movement, Exfiltration, and so on.
Identity and Access
Figure 6. Four ways to sign in, one session model.
- Roles: admin (everything), power (alerts, scans, capture, incident changes), and user (search and view).
- Per-index access: a user can be limited to a list of indexes, enforced inside the compiled SQL.
- Sessions: each user sees their active sessions with browser, IP, and sign-in method, and can end any of them. Admins can sign a user out on every device, for a lost laptop or a suspected compromise.
- Login protection: failed attempts are rate limited per user and IP, and every attempt, successful or not, is audited.
The Audit Trail
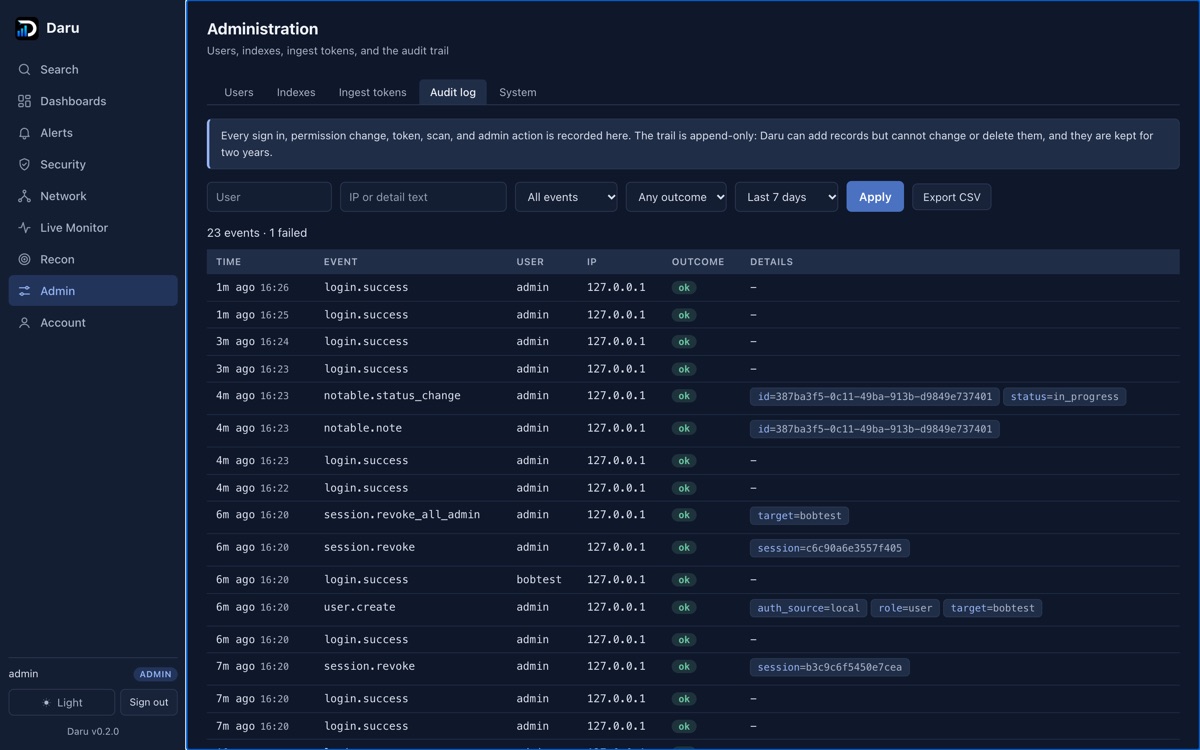
Auditors ask two questions: what happened, and can you prove nobody changed the record. Daru answers the second at the database level. The audit table is append-only for the account Daru itself uses: ClickHouse grants it INSERT and SELECT, and revokes ALTER DELETE and ALTER UPDATE on that one table. Even a compromised Daru process cannot erase its own tracks. A CI job creates a real ClickHouse user with these grants and proves that inserts work while delete, update, and truncate are refused.
| Recorded | Examples |
|---|---|
| Sign in | Successes, failures, rate-limited attempts, TOTP prompts, SSO refusals |
| Accounts | User creation, role changes, password resets, disabling, index access, sign out everywhere |
| Data | Ingest tokens, indexes, saved searches, alerts, dashboards |
| Security work | Scans, schedules, PCAP uploads, live captures and downloads, incident notes, assignment, and status |
Events are written by a background batcher that never blocks a request and flushes on shutdown, kept for two years, and also written to the server log so they can be forwarded elsewhere. Admins filter them by user, event type, outcome, IP, and time, and export CSV for an auditor.
Live Monitor and Packet Capture
Live Monitor turns the browser into a lightweight packet analyzer. Daru starts tcpdump (which holds the raw-socket capability) and pipes the stream into tshark for decoding, so Daru itself never needs to run as root. Decoded packets stream to the browser over Server-Sent Events.
Figure 7. One capture, three outputs: the live table, searchable events, and a .pcap file.
- The packet table shows time to the millisecond, source and destination, protocol, length, and a Host / SNI column. Pause freezes it while counting continues; a filter narrows it; clicking a packet shows every decoded field.
- Packets per second is measured from the packets' own timestamps, with a one-minute sparkline.
- Interfaces are classified as Wi-Fi, wired, VPN tunnel, or virtual, with the busiest first.
Recon and Network Visibility
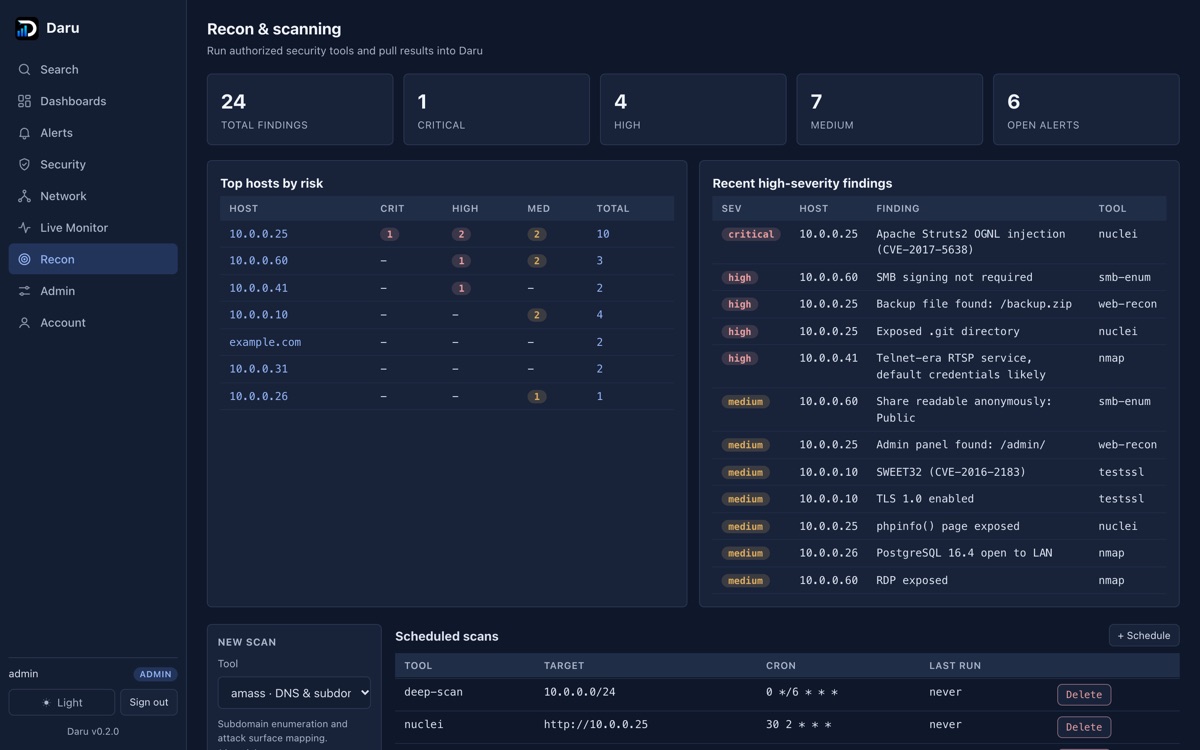
Daru can drive 59 standard security tools and pull their findings into search, the device inventory, and a posture overview. Every scan needs an authorization reference and an explicit confirmation, a scope guard refuses public targets unless allowed and blocks overly broad ranges, and each tool runs as an argument list from a vetted path, never through a shell.
Figure 8. The tool catalog. Tools with a native equivalent (DNS, TLS, certificate transparency, LAN discovery) keep working when the binary is missing.
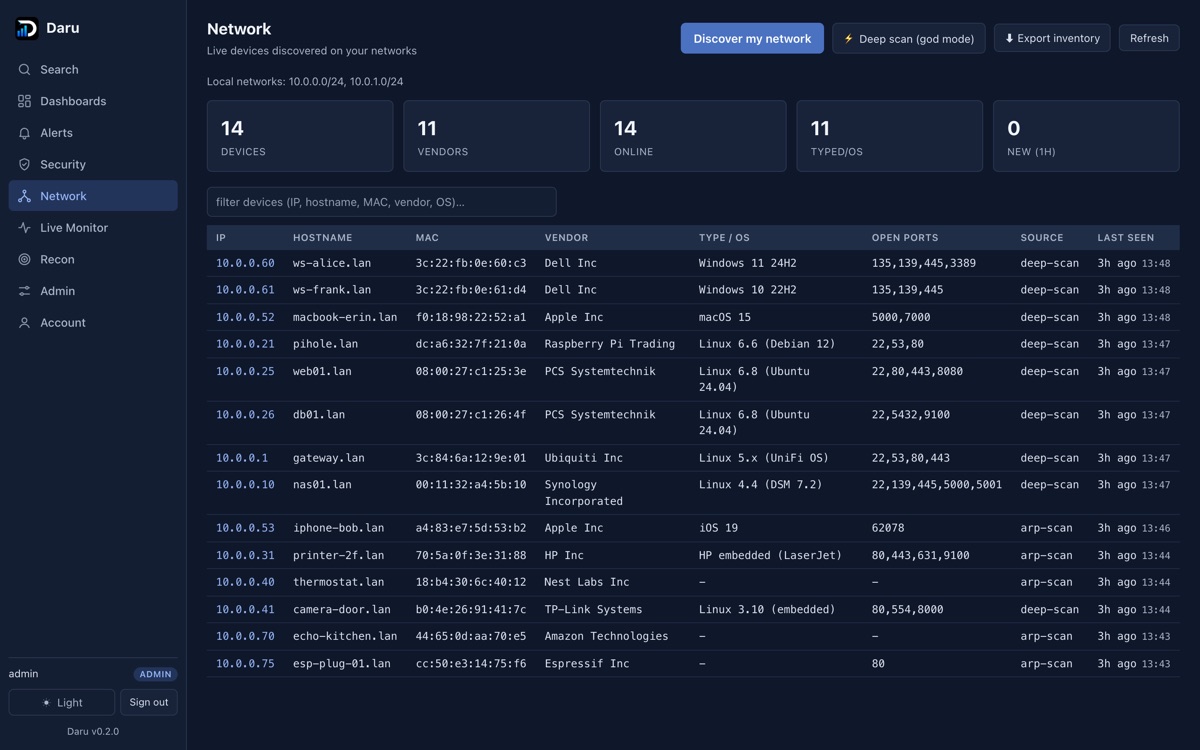
Discovered devices build an inventory with IP, hostname, MAC, vendor, operating system, and open ports. Each device has its own page collecting every finding from every tool, with HTML and CSV export, and scans can run on a cron schedule for continuous monitoring.
Data Model
Seventeen ClickHouse tables hold all of Daru's state, so a backup of the database is a backup of everything. The core relationships:
Figure 9. Events are partitioned by index and day, so retention drops whole partitions instead of deleting rows.
Component Reference
| Package | Responsibility | Notes |
|---|---|---|
cmd/daru | Configuration, startup, migrations, shutdown | Flushes queued audit events before exit |
internal/ingest | HEC, raw, JSON, and syslog parsing, field extraction | Pure functions, unit tested per format |
internal/query | Lexer, parser, and SQL compiler for the pipe language | 22 commands, permissions compiled into the SQL |
internal/search | Runs compiled queries with row and time caps | readonly=2 on every user search |
internal/store | ClickHouse access, schema, retention, audit, sessions | Split app and admin database users |
internal/auth | Passwords, TOTP, sessions, LDAP, OIDC, SAML | Argon2id, PKCE, signed SAML responses |
internal/alerts | Cron scheduler, conditions, signed webhooks | Respects each owner's index access |
internal/recon | 59 tool connectors, parsers, scope guard, live capture | Argument lists only, never a shell |
internal/api | 72 HTTP routes, CSRF, audit writer, syslog listener | Strict Content Security Policy |
internal/web | Embedded single-page interface | No framework, no inline scripts or styles |
Deployment
Figure 10. TLS terminates at a proxy; Daru and ClickHouse listen only on localhost.
- One command:
./install.shbuilds Daru, starts ClickHouse with Docker when available, writes generated passwords to~/.daru/daru.env, and prints the admin login. - Docker Compose: passwords are required, there are no defaults, and Daru is published on localhost only.
- Operations:
/api/healthfor liveness,/readyfor readiness (ClickHouse reachable),/metricsin Prometheus format, and backup and restore scripts that need onlycurlandtar. - Platforms: Linux, macOS, Windows, Raspberry Pi (64-bit, 4 GB+), and Android through Termux.
Quick Start
Option 1: One command (Linux, macOS, Raspberry Pi, Termux)
git clone https://github.com/TYFSADIK/daru && cd daru && ./install.shAdd --with-tools to also install the scanners. Then load the generated settings and start the server:
set -a; . ~/.daru/daru.env; set +a; daru serveOption 2: Docker Compose
cd deploy && export CLICKHOUSE_PASSWORD=$(openssl rand -hex 16) CLICKHOUSE_APP_PASSWORD=$(openssl rand -hex 16) DARU_ADMIN_PASSWORD=$(openssl rand -hex 16) && docker compose up -dOpen http://localhost:8088 and sign in as admin.
Send syslog from a Linux server
echo '*.* @@daru.example.com:5514' | sudo tee /etc/rsyslog.d/90-daru.conf && sudo systemctl restart rsyslogThen search index=syslog severity=error | stats count by host, app.
Key Features
- Search and dashboards: the pipe query language, charts with real axes, saved searches, and dashboards with share links and PDF and CSV export.
- Alerts and incidents: cron-scheduled searches, HMAC-signed webhooks, and an incident queue with notes, assignment, and a timeline, mapped to MITRE ATT&CK.
- Audit trail: append-only at the database level, filterable, exportable, kept two years.
- Identity: Argon2id, TOTP, LDAP and Active Directory, OIDC with PKCE, SAML 2.0, roles, per-index access, and session management.
- Syslog: RFC 5424 and 3164 over UDP and TCP with a sender allowlist and connection limits.
- Live Monitor: in-browser packet capture with Host / SNI decoding, pause, filter, packet details, and
.pcapdownload. - Network and recon: discovery, device intelligence, posture, scheduled scans, and 59 tools behind an authorization gate.
- Operations: per-index retention, ingest rate limits, scan quotas, health and readiness checks, Prometheus metrics, and backup scripts.
Screenshots
All screenshots use made-up demo data.
Security Design and Threat Model
A SIEM is a high-value target: it holds every log, it can run scanners, and it often runs with network privileges. Daru is built assuming an attacker will try each of these:
| Threat | Defence |
|---|---|
| Stolen or guessed password | Argon2id hashing, login rate limiting, TOTP, SSO, and an audit record of every attempt |
| Stolen session | HttpOnly cookies, Secure behind TLS, per-session revocation, sign out everywhere |
| Cross-site request forgery | Double-submit CSRF token on every write, SameSite cookies, Origin checks |
| Cross-site scripting | Content Security Policy with no inline scripts or styles; the UI inserts data as text, never as HTML |
| Reading another team's logs | Per-index access compiled into the SQL, outside anything the user typed |
| Query used to modify data | Searches run with ClickHouse readonly=2 under a user without schema rights |
| Covering tracks | Audit table is append-only for the app's database user, proven in CI |
| Command injection through scans | Tools run as argument lists, filters validated, no shell, root-owned binaries only when root |
| Scanning targets you do not own | Authorization reference, explicit confirmation, scope guard, per-user quotas |
| Log flooding | Global events-per-second limit shared by HTTP and syslog, syslog allowlist, TCP connection cap |
| Leaked captures | 0600 files in a 0700 folder, owner or admin only, deleted after 30 minutes, downloads audited |
Testing & Validation
After install, confirm the server and the database are both healthy:
curl -s -o /dev/null -w "%{http_code}\n" http://localhost:8088/readyYou should see 200. Send a test event with an ingest token from Admin > Ingest tokens, then search for it:
curl http://localhost:8088/services/collector -H "Authorization: Splunk YOUR_TOKEN" -d '{"event":"user=alice action=login status=200"}'Figure 11. Eleven CI jobs on every push.
Security claims are tested, not just written down: the audit table's permissions, session revocation, cross-user isolation, the syslog allowlist, and capture download permissions were each verified against a running instance.
Troubleshooting
- A search returns nothing: check the time range, and that the index exists under Admin > Indexes. Creating an ingest token creates its index.
- Packet capture fails: run
sh scripts/grant-capabilities.shonce so tcpdump can capture without running Daru as root. - Syslog arrives from unknown senders: set
DARU_SYSLOG_ALLOWto the networks that may send logs. - Upgrading an existing install: run the
REVOKEline indeploy/clickhouse-users.sqlonce so the audit trail becomes append-only.
Key Results
| Measure | Value |
|---|---|
| Go code (excluding tests) | about 20,900 lines across 10 packages |
| Web interface | about 2,750 lines of dependency-free JavaScript |
| Automated tests | 213 test functions in 37 files |
| HTTP API | 72 routes |
| Query language | 22 commands, compiled to one SQL statement |
| Storage | 17 ClickHouse tables, 2 database users with split privileges |
| Security tools | 59 across 8 categories |
| CI | 11 jobs, 7 build targets, all passing |
| Accessibility | every UI color measured against WCAG AA (4.5:1); the failures, as low as 3.2:1, fixed |
- Delivered a complete SIEM as one Go binary plus ClickHouse, with no API keys and no telemetry.
- Made the audit trail append-only at the database level and proved it in CI.
- Found and fixed real defects by testing against a live instance: logs in unregistered indexes were invisible to search, restarts reset custom retention, and the strict CSP had silently broken every chart.
Design Decisions
| Decision | Alternative | Why |
|---|---|---|
| ClickHouse for storage | Elasticsearch, PostgreSQL | Column storage compresses logs well and scans fast on one node; partitions make retention a cheap drop |
| Compile queries to SQL | Interpret results in Go | One round trip, the database does the heavy work, and permissions live in the query |
| One Go binary | Microservices | Nothing to orchestrate; the same file runs on a server, a laptop, or a Raspberry Pi |
| No front-end framework | React or Vue | Fits a strict CSP, no build step, nothing to update for security patches |
| Append-only audit by grant | Application-level checks only | A database grant holds even if the application is compromised |
| tcpdump piped to tshark | Run Daru as root | Capture privilege stays with one small tool; Daru runs as a normal user |
How I built it
Daru is designed around the daily work of a SOC analyst: search and alerting first, on hardware the organization controls, with the security controls an auditor asks for built in.
- Phase 1, storage and search: the ClickHouse schema, the lexer, parser, and SQL compiler, and HEC-compatible ingest so existing forwarders work unchanged.
- Phase 2, the product: the embedded web UI, dashboards, saved searches, cron alerts with signed webhooks, and the notable-event queue.
- Phase 3, identity: Argon2id, TOTP, roles, per-index access, then LDAP, OIDC, and SAML with protection against cross-method account takeover.
- Phase 4, security tooling: the recon runner with 59 connectors, the scope guard, network discovery, device intelligence, and Live Monitor.
- Phase 5, production hardening: split database privileges, the append-only audit trail, syslog, session management, incident timelines, measured accessibility, and a CI pipeline with linting and security scanning.
Challenges and Lessons Learned
- Test against the real thing: unit tests passed while real searches returned nothing, because data in unregistered indexes was invisible. Lesson: run the actual product with realistic data before calling it done.
- Security features can break features: a strict Content Security Policy silently blocked every inline style, so charts rendered as plain text. Lesson: check the browser console, and design the UI for the policy from the start.
- Restarts are part of the product: startup code reset custom retention to defaults, which would have deleted data on the next sweep. Lesson: defaults must only ever fill gaps.
- Make security provable: “the audit log cannot be changed” is only true if a test proves it, so the claim became a database grant checked in CI.
Limitations and Future Work
- No indexer acknowledgement endpoint: Splunk forwarders that require ack must use HEC without ack, or raw ingest.
- Wi-Fi details in Live Monitor (SSID, signal, link rate) are available on Linux only.
- Next: email and Slack alert actions, a password policy with lockout, built-in detection rules for common attacks, and an option to require two-factor for every account.
Frequently Asked Questions
Is Daru a replacement for Splunk?
For many small and mid-sized teams, yes: it covers search, dashboards, alerts, and incident triage, and speaks the Splunk HEC format so forwarders work unchanged. It does not implement every Splunk feature, such as indexer acknowledgement or apps.
Does any data leave my network?
No logs leave your machines. The only outbound calls are optional: certificate-transparency, DNS, and RDAP lookups when you run those recon tools, and the webhooks you configure.
How much hardware does it need?
A Raspberry Pi with a 64-bit OS and 4 GB of RAM can run it for a small network. For a company, a server with fast disks and enough memory for ClickHouse's working set is the main requirement.
Can I prove to an auditor that logs were not altered?
The audit trail is append-only at the database level: Daru's database user cannot delete or update it, and a CI check proves the grant. Events are also written to the server log for forwarding to a separate system.
Is it free?
Yes. Daru is open source under the MIT licence, with no per-gigabyte or per-user pricing.
References
- Daru repository, source, install scripts, and documentation.
- ClickHouse documentation, the storage engine behind every search.
- RFC 5424 and RFC 3164, the syslog formats Daru receives.
- MITRE ATT&CK, the tactic mapping used for incidents.
- Wireshark and tshark documentation, the decoder behind Live Monitor.
- WCAG 2.1, the accessibility standard the interface colors were measured against.
Cite This Page
Citation formats
Plain text
Taki Sadik, "Daru: Your Logs, Your Hardware, Your SIEM", TYFSADIK, https://tyfsadik.org/work/infrastructure/daru (accessed 2026-11-13).BibTeX
@misc{sadik-daru,
  author  = {Sadik, MD. Taki Yasir Faraji},
  title   = {Daru: Your Logs, Your Hardware, Your SIEM},
  year    = {2026},
  url     = {https://tyfsadik.org/work/infrastructure/daru},
  urldate = {2026-11-13}
}
APA
Sadik, M. T. Y. F. (2026). Daru: Your Logs, Your Hardware, Your SIEM. TYFSADIK. https://tyfsadik.org/work/infrastructure/daru